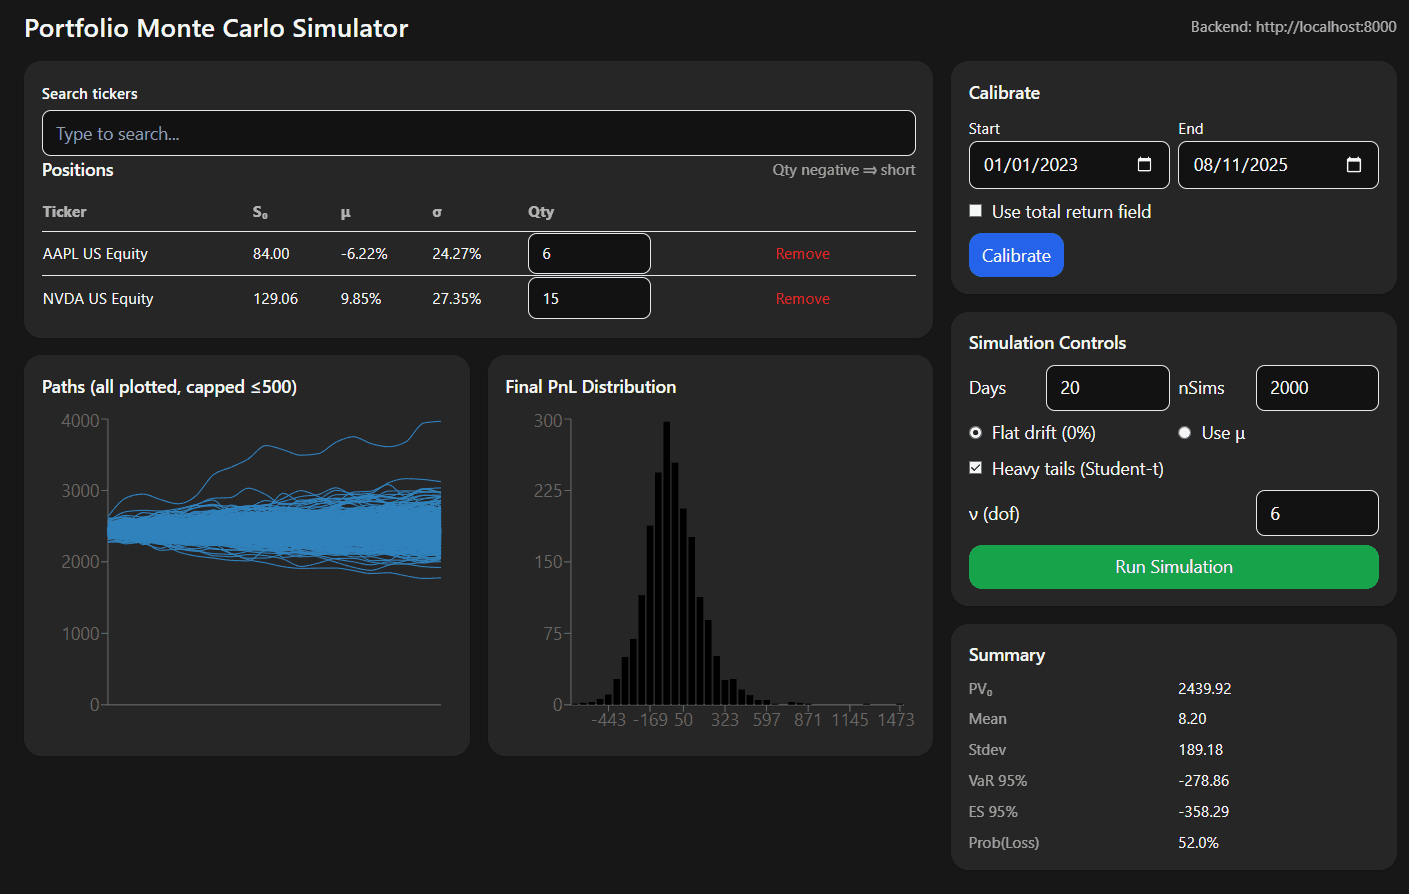
Monte Carlo Portfolio Simulator
A portfolio risk simulator: pick tickers and quantities, calibrate drift, volatility and correlation from history, and simulate the portfolio's profit and loss distribution. A FastAPI backend does the math; a React frontend shows the paths and the final P&L histogram. It runs against Bloomberg (Server/B-PIPE or Desktop API) or in a demo mode with no entitlements, and ships as Docker images with dev and prod profiles. I built it for my own studies.
Model
Each asset follows geometric Brownian motion in daily steps (Δt = 1/252): log S(t+Δt) = log S(t) + (μ − σ²/2)Δt + σ√Δt·ε, with ε drawn from a multivariate normal using the calibrated correlation matrix. For heavier tails, each simulation can be scaled elliptically by Z / √(χ²_ν/ν), which turns the normal draws into a multivariate Student-t.
Calibration pulls closing prices (or a total-return index), cleans them, and annualizes μ and σ. The Cholesky factorization of the correlation matrix uses diagonal loading, so a nearly singular matrix from short or collinear histories still factors.
Output
Portfolio value per day is Σ qtyᵢ·Sᵢ(t), and P&L is the change from day 0. The simulator reports mean, standard deviation, 95% VaR (5th percentile), 95% expected shortfall (the mean beyond it) and the probability of a loss.
Limitations
- Constant μ, σ and correlation over the horizon: no volatility clustering or regime changes.
- No multi-currency normalization; P&L is raw price × quantity.
- No options, implied vol or Greeks: it simulates the underlyings only.
- Not yet checked against an independent benchmark, such as closed-form VaR for a single asset.